“Life is a School of Probability” — Walter Bagehot
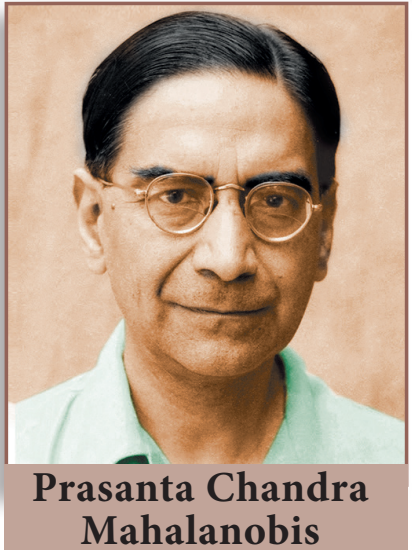
Prasanta Chandra Mahalanobis, born at Kolkata, was an Indian statistician who devised a measure of comparison between two data sets. He introduced innovative techniques for conducting large-scale sample surveys and calculated acreages and crop yields by using the method of random sampling. For his pioneering work, he was awarded the Padma Vibhushan, one of India’s highest honours, by the Indian government in 1968 and he is hailed as “Father of Indian Statistics”. The Government of India has designated 29th June every year, coinciding with his birth anniversary, as “National Statistics Day”.
‘STATISTICS’ is derived from the Latin word ‘status’ which means a political state. Today, statistics has become an integral part of everyone’s life, unavoidable whether making a plan for our future, doing a business, a marketing research or preparing economic reports. It is also extensively used in opinion polls, doing advanced research. The study of statistics is concerned with scientific methods for collecting, organising, summarising, presenting, analysing data and making meaningful decisions. In earlier classes we have studied about collection of data, presenting the data in tabular form, graphical form and calculating the Measures of Central Tendency. Now, in this class, let us study about the Measures of Dispersion.
It is often convenient to have one number that represent the whole data. Such a number is called a Measures of Central Tendency.
The Measures of Central Tendency usually will be near to the middle value of the data. For a given data there exist several types of measures of central tendencies.
The most common among them are
Arithmetic Mean
Median
Mode
Thinking Corner
Does the mean, median and mode are same for a given data?
What is the difference between the arithmetic mean and average?
Note
Data: The numerical representation of facts is called data.
Observation: Each entry in the data is called an observation.
Variable: The quantities which are being considered in a survey are called variables. Variables are generally denoted by $x_i$, $i=1,2,3,\ldots,n$.
Frequencies: The number of times, a variable occurs in a given data is called the frequency of that variable. Frequencies are generally denoted as $f_i$, $i=1,2,3,\ldots,n$.
In this class we have to recall the Arithmetic Mean.
The Arithmetic Mean or Mean of the given values is sum of all the observations divided by the total number of observations. It is denoted by $\bar x$ (pronounced as $x$ bar)
$$
\bar x=\frac{\text{Sum of all the observations}}{\text{Number of observations}}
$$
Thinking Corner
The mean of $n$ observations is $\bar x$, if first term is increased by 1 second term is increased by 2 and so on. What will be the new mean?
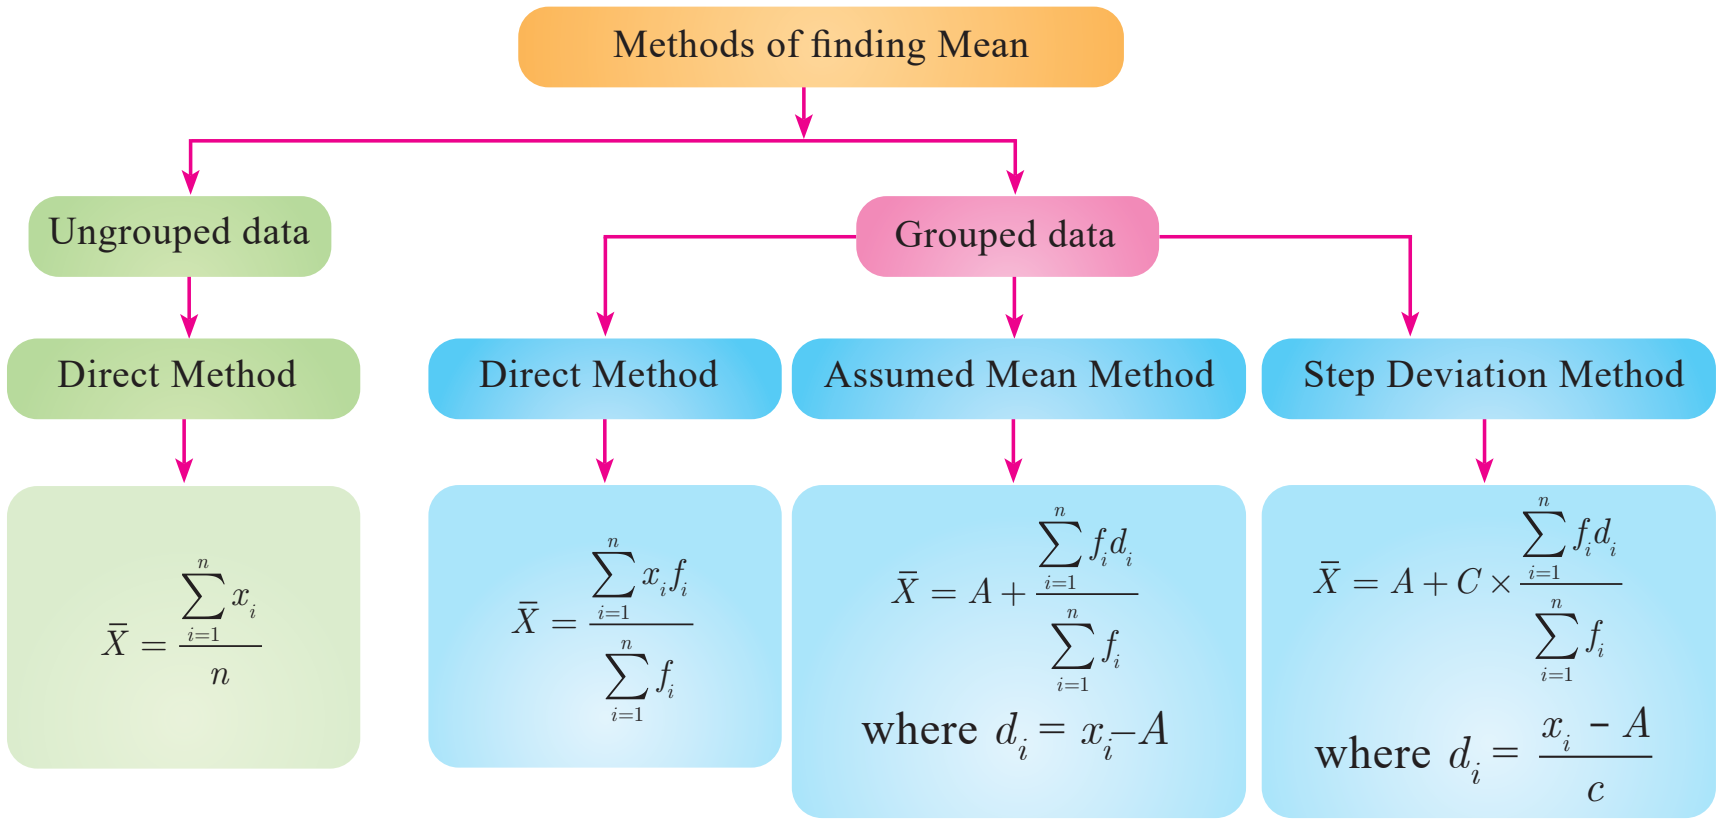
Methods of finding Mean: ungrouped and grouped data
We apply the respective formulae depending upon the information provided in the problem.
Progress Check
The sum of all the observations divided by number of observations is _______.
If the sum of 10 data values is 265 then their mean is _______.
If the sum and mean of a data are 407 and 11 respectively, then the number of observations in the data are _______.
The following data provide the runs scored by two batsmen in the last 10 matches.
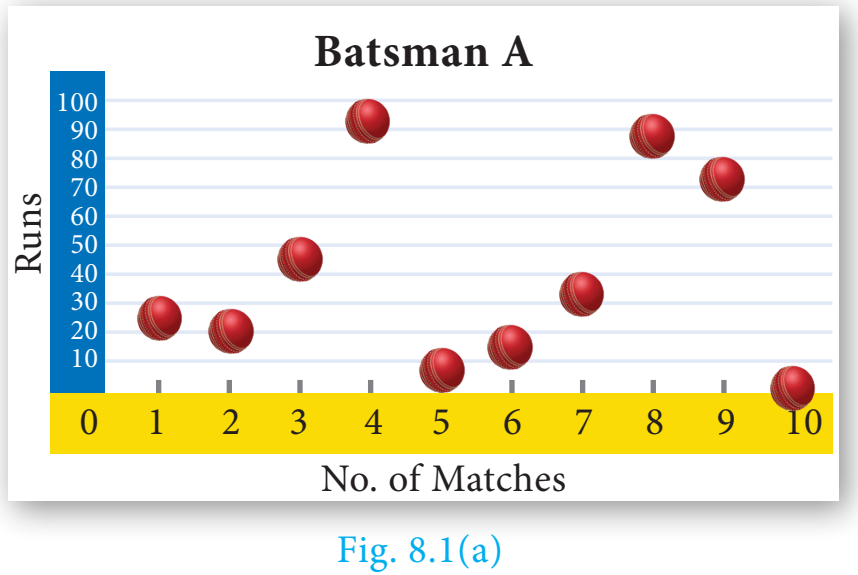
Batsman A: 25, 20, 45, 93, 8, 14, 32, 87, 72, 4
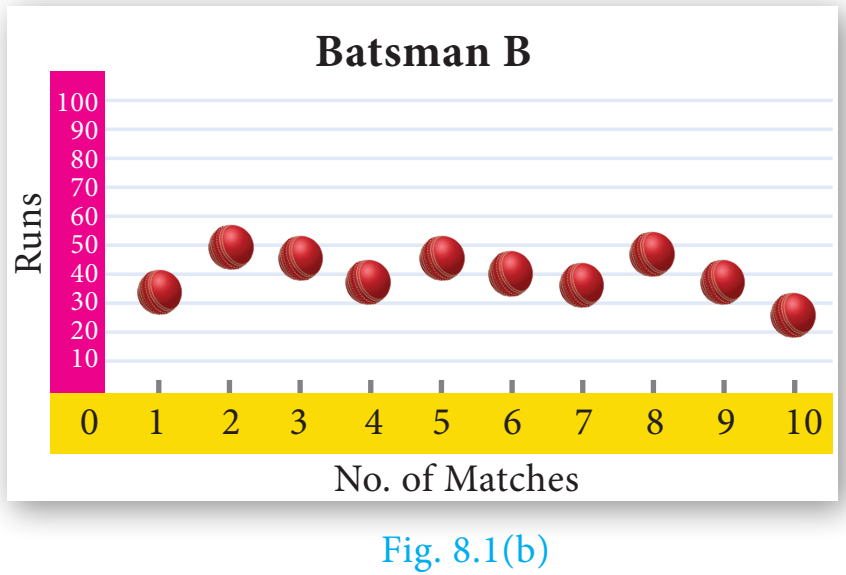
Batsman B: 33, 50, 47, 38, 45, 40, 36, 48, 37, 26
$$
\text{Mean of Batsman A}=\frac{25+20+45+93+8+14+32+87+72+4}{10}=40
$$$$
\text{Mean of Batsman B}=\frac{33+50+47+38+45+40+36+48+37+26}{10}=40
$$
The mean of both datas are same (40), but they differ significantly.
Fig. 8.1(a) — Batsman A
Fig. 8.1(b) — Batsman B
From the above diagrams, we see that runs of batsman $B$ are grouped around the mean. But the runs of batsman $A$ are scattered from 0 to 100, though they both have same mean.
Thus, some additional statistical information may be required to determine how the values are spread in data. For this, we shall discuss Measures of Dispersion.
Dispersion is a measure which gives an idea about the scatteredness of the values.
Measures of Variation (or) Dispersion of a data provide idea of how observations spread out (or) scattered throughout the data.
The range of a set of data does not give the clear idea about the dispersion of the data from measures of Central Tendency. For this, we need a measure which depend upon the deviation from the measures of Central Tendency.
For a given data with $n$ observations $x_1,x_2,\ldots,x_n$, the deviations from the mean $\bar x$ are $x_1-\bar x$, $x_2-\bar x$, $\ldots$, $x_n-\bar x$.
The squares of deviations from the mean $\bar x$ of the observations $x_1,x_2,\ldots,x_n$ are
$$
(x_1-\bar x)^2,(x_2-\bar x)^2,\ldots,(x_n-\bar x)^2\text{ or }\sum_{i=1}^n(x_i-\bar x)^2
$$
Note
We note that $(x_i-\bar x)\ge0$ for all observations $x_i$, $i=1,2,3,\ldots,n$. If the deviations from the mean $(x_i-\bar x)$ are small, then the squares of the deviations will be very small.
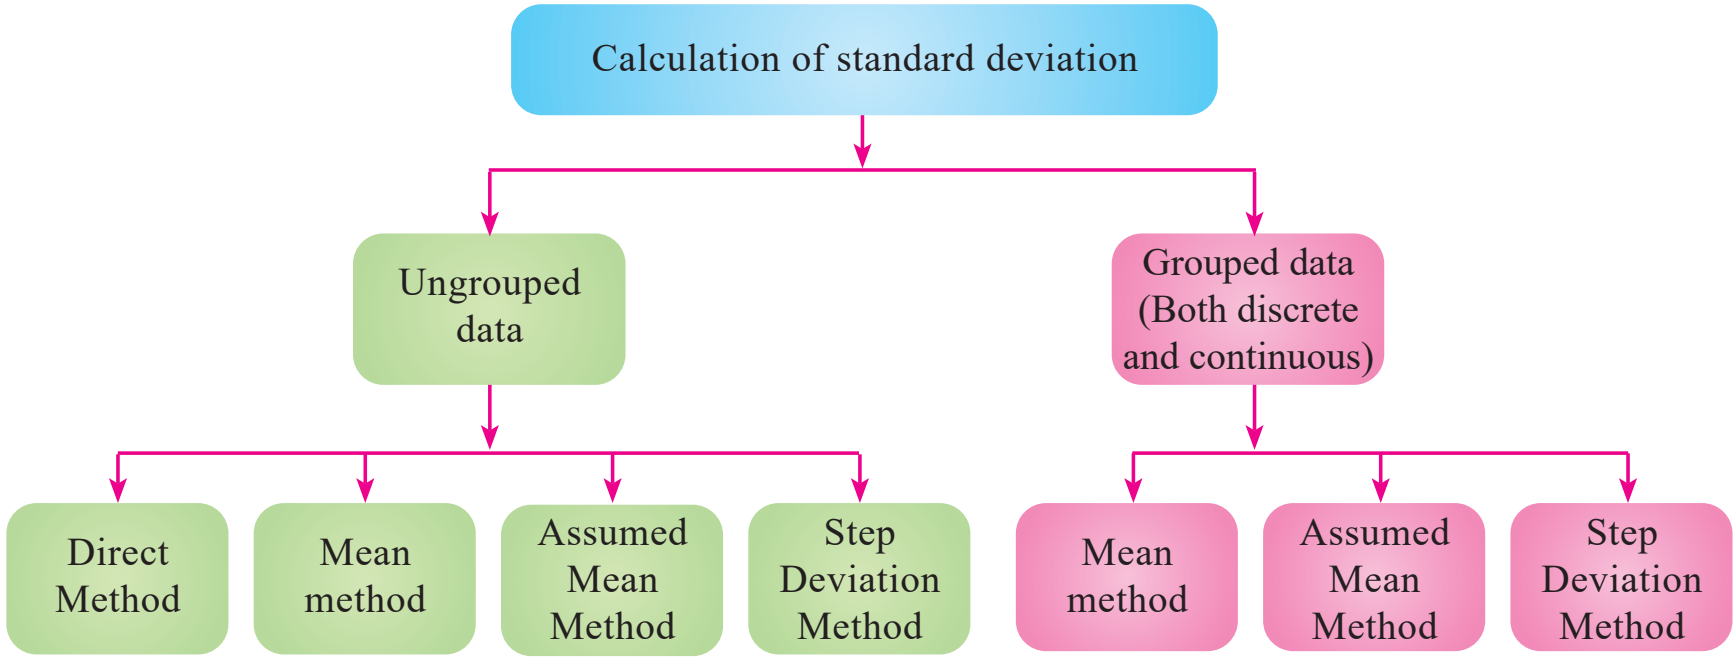
The positive square root of Variance is called Standard deviation. That is, standard deviation is the positive square root of the mean of the squares of deviations of the given values from their mean. It is denoted by $\sigma$.
Standard deviation gives a clear idea about how far the values are spreading or deviating from the mean.
The standard deviation and mean have same units in which the data are given.
Note
While computing standard deviation, arranging data in ascending order is not mandatory.
If the data values are given directly then to find standard deviation we can use the formula $\sigma=\sqrt{\dfrac{\sum x_i^2}{n}-\left(\dfrac{\sum x_i}{n}\right)^2}$.
If the data values are not given directly but the squares of the deviations from the mean of each observation is given then to find standard deviation we can use the formula $\sigma=\sqrt{\dfrac{\sum(x_i-\bar x)^2}{n}}$.
The amount of rainfall in a particular season for 6 days are given as 17.8 cm, 19.2 cm, 16.3 cm, 12.5 cm, 12.8 cm and 11.4 cm. Find its standard deviation.
Solution Arranging the numbers in ascending order we get, 11.4, 12.5, 12.8, 16.3, 17.8, 19.2. Number of observations $n=6$
When the mean value is not an integer (since calculations are very tedious in decimal form) then it is better to use the assumed mean method to find the standard deviation.
Let $x_1,x_2,x_3,\ldots,x_n$ be the given data values and let $\bar x$ be their mean.
Let $d_i$ be the deviation of $x_i$ from the assumed mean $A$, which is usually the middle value or near the middle value of the given data.
We can use any of the above methods for finding the standard deviation
Activity 1
Find the standard deviation of the marks obtained by you in all five subjects in the quarterly examination and in the midterm test separately. What do you observe from your results.
The amount that the children have spent for purchasing some eatables in one day trip of a school are 5, 10, 15, 20, 25, 30, 35, 40. Using step deviation method, find the standard deviation of the amount they have spent.
Solution We note that all the observations are divisible by 5. Hence we can use the step deviation method. Let the Assumed mean $A=20$, $n=8$.
48 students were asked to write the total number of hours per week they spent on watching television. With this information find the standard deviation of hours spent for watching television.
Let $x_1,x_2,x_3,\ldots x_n$ be the given data with frequencies $f_1,f_2,f_3,\ldots f_n$ respectively. Let $\bar{x}$ be their mean and $A$ be the assumed mean.
where, $x_i=$ Middle value of the $i$th class. $f_i=$ Frequency of the $i$th class.
(ii) Shortcut method (or) Step deviation method
To make the calculation simple, we provide the following formula. Let $A$ be the assumed mean, $x_i$ be the middle value of the $i$th class and $c$ is the width of the class interval.
The mean and standard deviation of 15 observations are found to be 10 and 5 respectively. On rechecking it was found that one of the observation with value 8 was incorrect. Calculate the correct mean and standard deviation if the correct observation value was 23?
Find the range and coefficient of range of the following data.
(i) 63, 89, 98, 125, 79, 108, 117, 68
(ii) 43.5, 13.6, 18.9, 38.4, 61.4, 29.8
If the range and the smallest value of a set of data are 36.8 and 13.4 respectively, then find the largest value.
Calculate the range of the following data.
Income
400–450
450–500
500–550
550–600
600–650
Number of workers
8
12
30
21
6
A teacher asked the students to complete 60 pages of a record note book. Eight students have completed only 32, 35, 37, 30, 33, 36, 35 and 37 pages. Find the standard deviation of the pages completed by them.
Find the variance and standard deviation of the wages of 9 workers given below: ₹310, ₹290, ₹320, ₹280, ₹300, ₹290, ₹320, ₹310, ₹280.
A wall clock strikes the bell once at 1 o’ clock, 2 times at 2 o’ clock, 3 times at 3 o’ clock and so on. How many times will it strike in a particular day. Find the standard deviation of the number of strikes the bell make a day.
Find the standard deviation of first 21 natural numbers.
If the standard deviation of a data is 4.5 and if each value of the data is decreased by 5, then find the new standard deviation.
If the standard deviation of a data is 3.6 and each value of the data is divided by 3, then find the new variance and new standard deviation.
The rainfall recorded in various places of five districts in a week are given below. Find its standard deviation.
Rainfall (in mm)
45
50
55
60
65
70
Number of places
5
13
4
9
5
4
In a study about viral fever, the number of people affected in a town were noted as Find its standard deviation.
Age in years
0–10
10–20
20–30
30–40
40–50
50–60
60–70
Number of people affected
3
5
16
18
12
7
4
The measurements of the diameters (in cms) of the plates prepared in a factory are given below. Find its standard deviation.
Diameter (cm)
21–24
25–28
29–32
33–36
37–40
41–44
Number of plates
15
18
20
16
8
7
The time taken by 50 students to complete a 100 meter race are given below. Find its standard deviation.
Time taken (sec)
8.5–9.5
9.5–10.5
10.5–11.5
11.5–12.5
12.5–13.5
Number of students
6
8
17
10
9
For a group of 100 candidates the mean and standard deviation of their marks were found to be 60 and 15 respectively. Later on it was found that the scores 45 and 72 were wrongly entered as 40 and 27. Find the correct mean and standard deviation.
The mean and variance of seven observations are 8 and 16 respectively. If five of these are 2, 4, 10, 12 and 14, then find the remaining observations.
Comparison of two data in terms of measures of central tendencies and dispersions in some cases will not be meaningful, because the variables in the data may not have same units of measurement.
For example consider the two data
Weight
Price
Mean
8 kg
₹85
Standard deviation
1.5 kg
₹21.60
Here we cannot compare the standard deviations 1.5kg and ₹21.60. For comparing two or more data for corresponding changes the relative measure of standard deviation, called “Coefficient of variation” is used.
Coefficient of variation of a data is obtained by dividing the standard deviation by the arithmetic mean. It is usually expressed in terms of percentage. This concept is suggested by one of the most prominent Statistician Karl Pearson.
$$
\text{Thus, coefficient of variation of first data }(\mathrm{C.V.}_1)=\frac{\sigma_1}{\bar{x}_1}\times100\%
$$$$
\text{coefficient of variation of second data }(\mathrm{C.V.}_2)=\frac{\sigma_2}{\bar{x}_2}\times100\%
$$
The data with lesser coefficient of variation is more consistent or stable than the other data.
Consider the two data
A
500
900
800
900
700
400
B
300
540
480
540
420
240
Mean
Standard deviation
A
700
191.5
B
420
114.9
If we compare the mean and standard deviation of the two data, we think that the two datas are entirely different. But mean and standard deviation of $B$ are 60% of that of $A$. Because of the smaller mean the smaller standard deviation led to the misinterpretation.
$$
\text{To compare the dispersion of two data, coefficient of variation}=\frac{\sigma}{\bar{x}}\times100\%
$$$$
\text{The coefficient of variation of }A=\frac{191.5}{700}\times100\%=27.4\%
$$$$
\text{The coefficient of variation of }B=\frac{114.9}{420}\times100\%=27.4\%
$$
Thus the two data have equal coefficient of variation. Since the data have equal coefficient of variation values, we can conclude that one data depends on the other. But the data values of $B$ are exactly 60% of the corresponding data values of $A$. So they are very much related. Thus, we get a confusing situation.
To get clear picture of the given data, we can find their coefficient of variation. This is why we need coefficient of variation.
Progress Check
Coefficient of variation is a relative measure of ________.
When the standard deviation is divided by the mean we get ________.
The coefficient of variation depends upon ________ and ________.
If the mean and standard deviation of a data are 8 and 2 respectively then the coefficient of variation is ________.
When comparing two data, the data with ________ coefficient of variation is inconsistent.
The standard deviation and mean of a data are 6.5 and 12.5 respectively. Find the coefficient of variation.
The standard deviation and coefficient of variation of a data are 1.2 and 25.6 respectively. Find the value of mean.
If the mean and coefficient of variation of a data are 15 and 48 respectively, then find the value of standard deviation.
If $n=5$, $\bar{x}=6$, $\sum x^2=765$, then calculate the coefficient of variation.
Find the coefficient of variation of 24, 26, 33, 37, 29, 31.
The time taken (in minutes) to complete a homework by 8 students in a day are given by 38, 40, 47, 44, 46, 43, 49, 53. Find the coefficient of variation.
The total marks scored by two students Sathya and Vidhya in 5 subjects are 460 and 480 with standard deviation 4.6 and 2.4 respectively. Who is more consistent in performance?
The mean and standard deviation of marks obtained by 40 students of a class in three subjects Mathematics, Science and Social Science are given below.
Subject
Mean
SD
Mathematics
56
12
Science
65
14
Social Science
60
10
Which of the three subjects shows more consistent and which shows less consistent in marks?
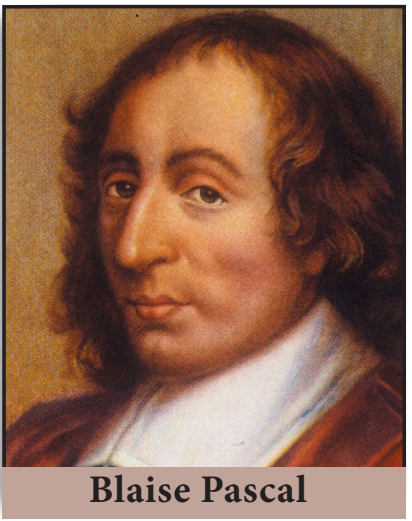
Few centuries ago, gambling and gaming were considered to be fashionable and became widely popular among many men. As the games became more complicated, players were interested in knowing the chances of winning or losing a game from a given situation. In 1654, Chevalier de Mere, a French nobleman with a taste of gambling, wrote a letter to one of the prominent mathematician of the time, Blaise Pascal, seeking his advice about how much dividend he would get for a gambling game played by paying money. Pascal worked this problem mathematically but thought of sharing this problem and see how his good friend and mathematician Pierre de Fermat could solve. Their subsequent correspondences on the issue represented the birth of Probability Theory as a new branch of mathematics.
The set of all possible outcomes in a random experiment is called a sample space. It is generally denoted by $S$.
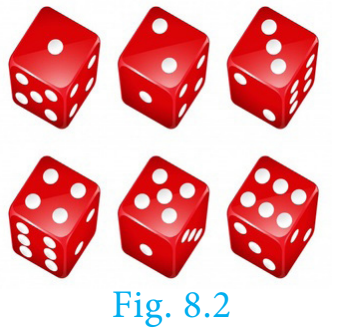
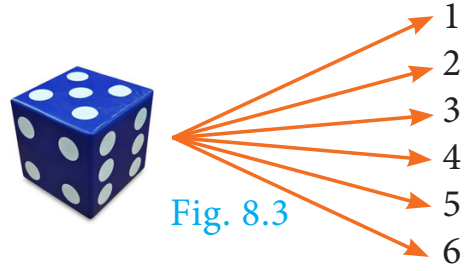
Example: When we roll a die, the possible outcomes are the face numbers 1, 2, 3, 4, 5, 6 of the die. Therefore the sample space is $S=\{1,2,3,4,5,6\}$.
Fig. 8.2
Sample point Each element of a sample space is called a sample point.
Event: In a random experiment, each possible outcome is called an event. Thus, an event will be a subset of the sample space.
Example: Getting two heads when we toss two coins is an event.
Trial: Performing an experiment once is called a trial.
Example: When we toss a coin thrice, then each toss of a coin is a trial.
Events
Explanation
Example
Equally likely events
Two or more events are said to be equally likely if each one of them has an equal chance of occurring.
Head and tail are equally likely events in tossing a coin.
Certain events
In an experiment, the event which surely occur is called certain event.
When we roll a die, the event of getting any natural number from one to six is a certain event.
Impossible events
In an experiment if an event has no scope to occur then it is called an impossible event.
When we toss two coins, the event of getting three heads is an impossible event.
Mutually exclusive events
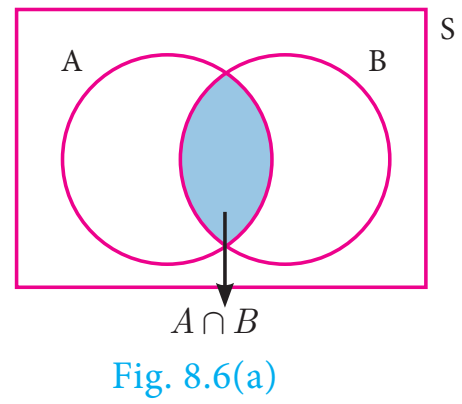
Two or more events are said to be mutually exclusive if they don’t have common sample points. i.e., events $A$, $B$ are said to be mutually exclusive if $A\cap B=\phi$.
When we roll a die the events of getting odd numbers and even numbers are mutually exclusive events.
Exhaustive events
The collection of events whose union is the whole sample space are called exhaustive events.
When we toss a coin twice, the collection of events of getting two heads, exactly one head, no head are exhaustive events.
Complementary events
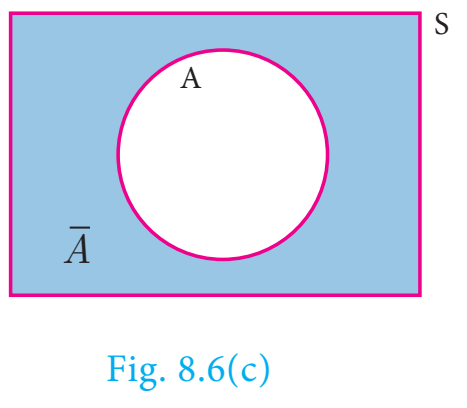
The complement of an event $A$ is the event representing collection of sample points not in $A$. It is denoted $A'$ or $A^c$ or $\overline A$. The event $A$ and its complement $A'$ are mutually exclusive and exhaustive.
When we roll a die, the event ‘rolling a 5 or 6’ and the event of rolling a 1, 2, 3 or 4 are complementary events.
Note
Elementary event: If an event $E$ consists of only one outcome then it is called an elementary event.
Do You Know?
In 1713, Bernoulli was the first to recognise the wide-range applicability of probability in fields outside gambling
In a random experiment, let $S$ be the sample space and $E\subseteq S$. Then if $E$ is an event, the probability of occurrence of $E$ is defined as
$$
P(E)=\frac{\text{Number of outcomes favourable to occurrence of }E}{\text{Number of all possible outcomes}}=\frac{n(E)}{n(S)}
$$
This way of defining the probability is applicable only to finite sample spaces. So in this chapter, we will be dealing problems only with finite sample spaces.
Note
$P(E)=\dfrac{n(E)}{n(S)}$
$P(S)=\dfrac{n(S)}{n(S)}=1$. The probability of sure event is 1.
$P(\phi)=\dfrac{n(\phi)}{n(s)}=\dfrac{0}{n(s)}=0$. The probability of impossible event is 0.
Since $E$ is a subset of $S$ and $\phi$ is a subset of any set,
Therefore, the probability value always lies from 0 to 1.
The complement event of $E$ is $\overline E$.
Let $P(E)=\dfrac mn$ (where $m$ is the number of favourable outcomes of $E$ and $n$ is the total number of possible outcomes).
$$
> P(\overline E)=\frac{\text{Number of outcomes unfavourable to occurrence of }E}{\text{Number of all possible outcomes}}
> $$$$
> P(\overline E)=\frac{n-m}{n}=1-\frac mn
> $$$$
> P(\overline E)=1-P(E)
> $$
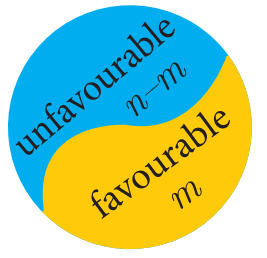
Favourable and unfavourable outcomes
$P(E)+P(\overline E)=1$
Progress Check
Which of the following values cannot be a probability of an event?
A bag contains 5 blue balls and 4 green balls. A ball is drawn at random from the bag. Find the probability that the ball drawn is (i) blue (ii) not blue.
Solution
Total number of possible outcomes $n(S)=5+4=9$
(i) Let $A$ be the event of getting a blue ball.
Number of favourable outcomes for the event $A$. Therefore, $n(A)=5$
Probability that the ball drawn is blue. Therefore,
$$
P(A)=\frac{n(A)}{n(S)}=\frac59
$$
(ii) $\overline A$ will be the event of not getting a blue ball. So
There are three routes $R_1$, $R_2$ and $R_3$ from Madhu’s home to her place of work. There are four parking lots $P_1$, $P_2$, $P_3$, $P_4$ and three entrances $B_1$, $B_2$, $B_3$ into the office building. There are two elevators $E_1$ and $E_2$ to her floor. Using the tree diagram explain how many ways she can reach her office?
Activity 4
Collect the details and find the probabilities of
(i) selecting a boy from your class.
(ii) selecting a girl from your class.
(iii) selecting a student from tenth standard in your school.
(iv) selecting a boy from tenth standard in your school.
(v) selecting a girl from tenth standard in your school.
A bag contains 6 green balls, some black and red balls. Number of black balls is as twice as the number of red balls. Probability of getting a green ball is thrice the probability of getting a red ball. Find (i) number of black balls (ii) total number of balls.
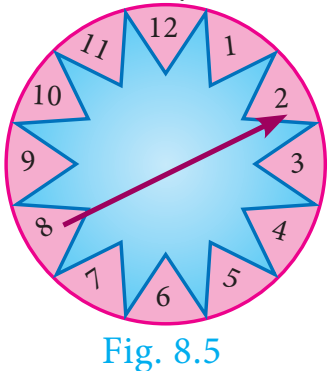
A game of chance consists of spinning an arrow which is equally likely to come to rest pointing to one of the numbers 1, 2, 3, …12. What is the probability that it will point to (i) 7 (ii) a prime number (iii) a composite number?
Solution
Sample space $S=\{1,2,3,4,5,6,7,8,9,10,11,12\}$; $n(S)=12$
(i) Let $A$ be the event of resting in 7. $n(A)=1$
$$
P(A)=\frac{n(A)}{n(S)}=\frac1{12}
$$
Fig. 8.5
(ii) Let $B$ be the event that the arrow will come to rest in a prime number.
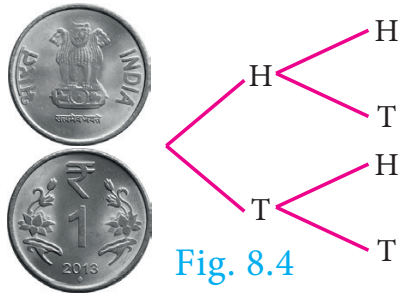
Write the sample space for tossing three coins using tree diagram.
Write the sample space for selecting two balls at a time from a bag containing 6 balls numbered 1 to 6 (using tree diagram).
If $A$ is an event of a random experiment such that $P(A):P(\overline A)=17:15$ and $n(S)=640$ then find (i) $P(\overline A)$ (ii) $n(A)$.
A coin is tossed thrice. What is the probability of getting two consecutive tails?
At a fete, cards bearing numbers 1 to 1000, one number on one card are put in a box. Each player selects one card at random and that card is not replaced. If the selected card has a perfect square number greater than 500, the player wins a prize. What is the probability that (i) the first player wins a prize (ii) the second player wins a prize, if the first has won?
A bag contains 12 blue balls and $x$ red balls. If one ball is drawn at random (i) what is the probability that it will be a red ball? (ii) If 8 more red balls are put in the bag, and if the probability of drawing a red ball will be twice that of the probability in (i), then find $x$.
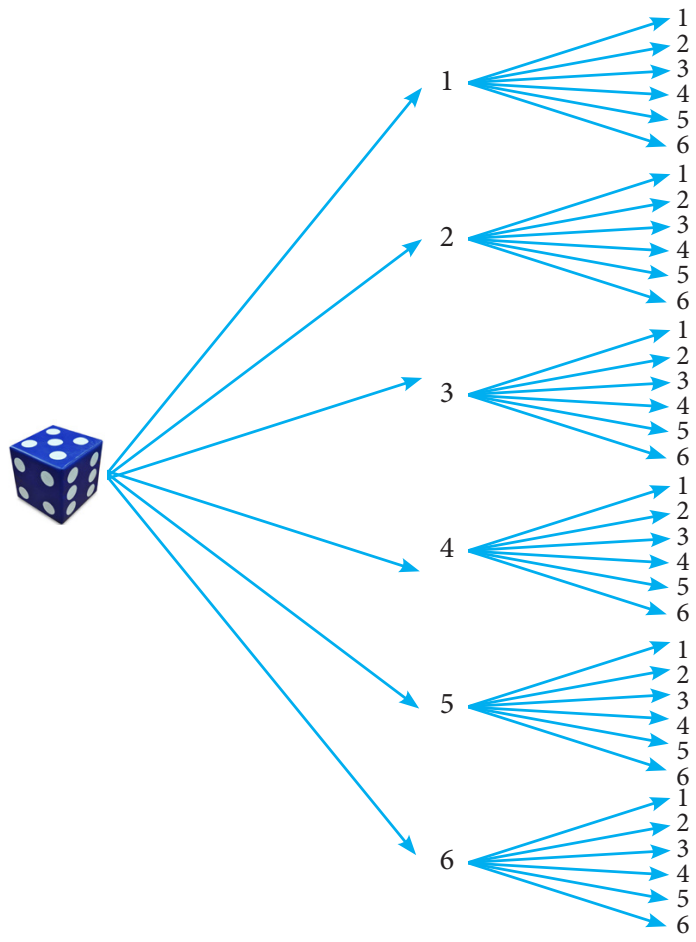
Two unbiased dice are rolled once. Find the probability of getting
(i) a doublet (equal numbers on both dice)
(ii) the product as a prime number
(iii) the sum as a prime number
(iv) the sum as 1
Three fair coins are tossed together. Find the probability of getting
(i) all heads
(ii) atleast one tail
(iii) atmost one head
(iv) atmost two tails
A bag contains 5 red balls, 6 white balls, 7 green balls, 8 black balls. One ball is drawn at random from the bag. Find the probability that the ball drawn is
(i) white
(ii) black or red
(iii) not white
(iv) neither white nor black
In a box there are 20 non-defective and some defective bulbs. If the probability that a bulb selected at random from the box found to be defective is $\dfrac38$ then, find the number of defective bulbs.
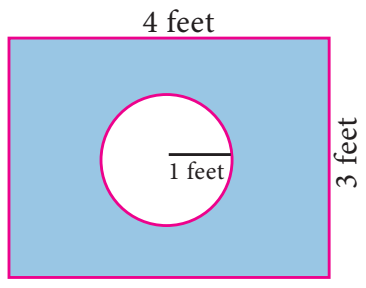
Some boys are playing a game, in which the stone thrown by them landing in a circular region (given in the figure) is considered as win and landing other than the circular region is considered as loss. What is the probability to win the game? $(\pi=3.14)$
Circular winning region within a rectangle
Two customers Priya and Amuthan are visiting a particular shop in the same week (Monday to Saturday). Each is equally likely to visit the shop on any one day as on another day. What is the probability that both will visit the shop on
(i) the same day (ii) different days (iii) consecutive days?
In a game, the entry fee is ₹150. The game consists of tossing a coin 3 times. Dhana bought a ticket for entry. If one or two heads show, she gets her entry fee back. If she throws 3 heads, she receives double the entry fees. Otherwise she will lose. Find the probability that she (i) gets double entry fee (ii) just gets her entry fee (iii) loses the entry fee.
A flower is selected at random from a basket containing 80 yellow, 70 red and 50 white flowers. Find the probability of selecting a yellow or red flower?
$$
P(A)=\frac{n(A)}{n(S)}=\frac6{36}
$$$$
P(B)=\frac{n(B)}{n(S)}=\frac3{36}
$$$$
P(A\cap B)=\frac{n(A\cap B)}{n(S)}=\frac1{36}
$$$$
\therefore P(\text{getting a doublet or a total of 4})=P(A\cup B)
$$$$
\begin{aligned}
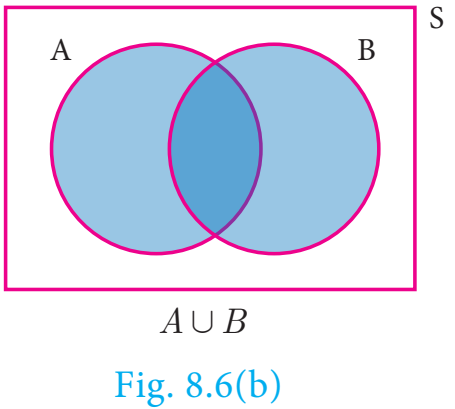
P(A\cup B)&=P(A)+P(B)-P(A\cap B)\\
&=\frac6{36}+\frac3{36}-\frac1{36}=\frac8{36}=\frac29
\end{aligned}
$$
If $A$ and $B$ are two events such that $P(A)=\frac14$, $P(B)=\frac12$ and $P(A\text{ and }B)=\frac18$, find (i) $P(A\text{ or }B)$ (ii) $P(\text{not }A\text{ and not }B)$.
Solution
(i)
$$
\begin{aligned}
P(A\text{ or }B)&=P(A\cup B)\\
&=P(A)+P(B)-P(A\cap B)
\end{aligned}
$$$$
P(A\text{ or }B)=\frac14+\frac12-\frac18=\frac58
$$
(ii)
$$
\begin{aligned}
P(\text{not }A\text{ and not }B)&=P(\overline A\cap\overline B)\\
&=P(\overline{A\cup B})\\
&=1-P(A\cup B)
\end{aligned}
$$$$
P(\text{not }A\text{ and not }B)=1-\frac58=\frac38
$$
In an apartment, in selecting a house from door numbers 1 to 100 randomly, find the probability of getting the door number of the house to be an even number or a perfect square number or a perfect cube number.
In a class of 50 students, 28 opted for NCC, 30 opted for NSS and 18 opted both NCC and NSS. One of the students is selected at random. Find the probability that
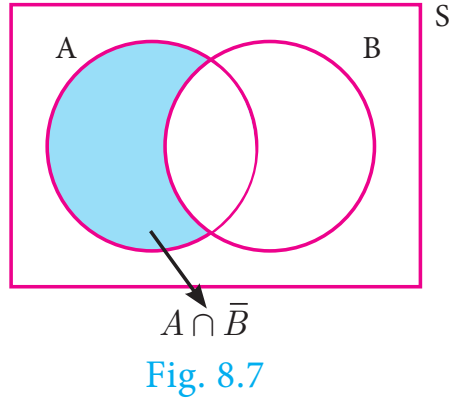
(i) The student opted for NCC but not NSS.
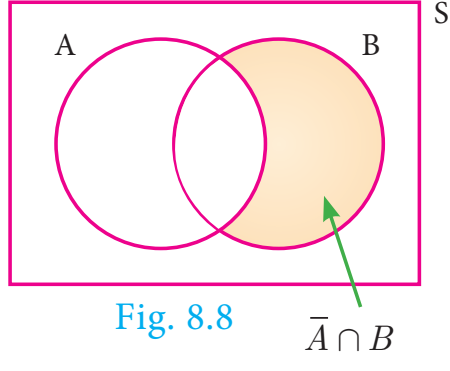
(ii) The student opted for NSS but not NCC.
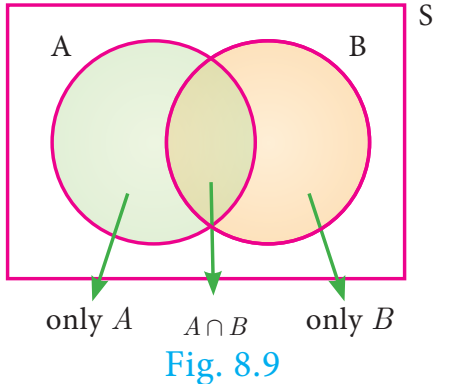
(iii) The student opted for exactly one of them.
Solution Total number of students $n(S)=50$.
Let $A$ and $B$ be the events of students opted for NCC and NSS respectively.
$A$ and $B$ are two candidates seeking admission to IIT. The probability that $A$ getting selected is 0.5 and the probability that both $A$ and $B$ getting selected is 0.3. Prove that the probability of $B$ being selected is atmost 0.8.
If $P(A)=\frac23$, $P(B)=\frac25$, $P(A\cup B)=\frac13$ then find $P(A\cap B)$.
$A$ and $B$ are two events such that, $P(A)=0.42$, $P(B)=0.48$, and $P(A\cap B)=0.16$. Find (i) $P(\text{not }A)$ (ii) $P(\text{not }B)$ (iii) $P(A\text{ or }B)$
If $A$ and $B$ are two mutually exclusive events of a random experiment and $P(\text{not }A)=0.45$, $P(A\cup B)=0.65$, then find $P(B)$.
The probability that atleast one of $A$ and $B$ occur is 0.6. If $A$ and $B$ occur simultaneously with probability 0.2, then find $P(\overline A)+P(\overline B)$.
The probability of happening of an event $A$ is 0.5 and that of $B$ is 0.3. If $A$ and $B$ are mutually exclusive events, then find the probability that neither $A$ nor $B$ happen.
Two dice are rolled once. Find the probability of getting an even number on the first die or a total of face sum 8.
A box contains cards numbered $3,5,7,9,\ldots,35,37$. A card is drawn at random from the box. Find the probability that the drawn card have either multiples of 7 or a prime number.
Three unbiased coins are tossed once. Find the probability of getting atmost 2 tails or atleast 2 heads.
The probability that a person will get an electrification contract is $\frac35$ and the probability that he will not get plumbing contract is $\frac58$. The probability of getting atleast one contract is $\frac57$. What is the probability that he will get both?
In a town of 8000 people, 1300 are over 50 years and 3000 are females. It is known that 30% of the females are over 50 years. What is the probability that a chosen individual from the town is either a female or over 50 years?
A coin is tossed thrice. Find the probability of getting exactly two heads or atleast one tail or two consecutive heads.
If $A,B,C$ are any three events such that probability of $B$ is twice as that of probability of $A$ and probability of $C$ is thrice as that of probability of $A$ and if $P(A\cap B)=\frac16$, $P(B\cap C)=\frac14$, $P(A\cap C)=\frac18$, $P(A\cup B\cup C)=\frac9{10}$, $P(A\cap B\cap C)=\frac1{15}$, then find $P(A),P(B)$ and $P(C)$?
In a class of 35, students are numbered from 1 to 35. The ratio of boys to girls is 4:3. The roll numbers of students begin with boys and end with girls. Find the probability that a student selected is either a boy with prime roll number or a girl with composite roll number or an even roll number.
The probability of getting a job for a person is $\frac x3$. If the probability of not getting the job is $\frac23$ then the value of $x$ is
(A) 2 (B) 1 (C) 3 (D) 1.5
Kamalam went to play a lucky draw contest. 135 tickets of the lucky draw were sold. If the probability of Kamalam winning is $\frac19$, then the number of tickets bought by Kamalam is
(A) 5 (B) 10 (C) 15 (D) 20
If a letter is chosen at random from the English alphabets $\{a,b,\ldots,z\}$, then the probability that the letter chosen precedes $x$
A purse contains 10 notes of ₹2000, 15 notes of ₹500, and 25 notes of ₹200. One note is drawn at random. What is the probability that the note is either a ₹500 note or ₹200 note?
The mean of the following frequency distribution is 62.8 and the sum of all frequencies is 50. Compute the missing frequencies $f_1$ and $f_2$.
Class Interval
0–20
20–40
40–60
60–80
80–100
100–120
Frequency
5
$f_1$
10
$f_2$
7
8
The diameter of circles (in mm) drawn in a design are given below.
Diameters
33–36
37–40
41–44
45–48
49–52
Number of circles
15
17
21
22
25
Calculate the standard deviation.
The frequency distribution is given below.
$x$
$k$
$2k$
$3k$
$4k$
$5k$
$6k$
$f$
2
1
1
1
1
1
In the table, $k$ is a positive integer, has a varience of 160. Determine the value of $k$.
The standard deviation of some temperature data in degree celsius (°C) is 5. If the data were converted into degree Farenheit (°F) then what is the variance?
If for a distribution, $\sum(x-5)=3$, $\sum(x-5)^2=43$, and total number of observations is 18, find the mean and standard deviation.
Prices of peanut packets in various places of two cities are given below. In which city, prices were more stable?
Prices in city A
20
22
19
23
16
Prices in city B
10
20
18
12
15
If the range and coefficient of range of the data are 20 and 0.2 respectively, then find the largest and smallest values of the data.
If two dice are rolled, then find the probability of getting the product of face value 6 or the difference of face values 5.
In a two children family, find the probability that there is at least one girl in a family.
A bag contains 5 white and some black balls. If the probability of drawing a black ball from the bag is twice the probability of drawing a white ball then find the number of black balls.
The probability that a student will pass the final examination in both English and Tamil is 0.5 and the probability of passing neither is 0.1. If the probability of passing the English examination is 0.75, what is the probability of passing the Tamil examination?
If the C.V. value is less, then the observations of corresponding data are consistent. If the C.V. value is more then the observations of corresponding data are inconsistent.
In a random experiment, the set of all outcomes are known but exact outcome is not known.
The set of all possible outcomes is called sample space.
$A,B$ are said to be mutually exclusive events if $A\cap B=\phi$
Probability of event $E$ is $P(E)=\frac{n(E)}{n(S)}$
(i) The probability of sure event is 1 and the probability of impossible event is 0.
(ii) $0\leq P(E)\leq1$; (iii) $P(\overline E)=1-P(E)$
If $A$ and $B$ are mutually exclusive events then $P(A\cup B)=P(A)+P(B)$.
Step 1: Open the Browser type the URL Link given below (or) Scan the QR Code. Chapter named “Probability” will open. Select the work sheet “Probability Addition law”
Step 2: In the given worksheet you can change the question by clicking on “New Problem”. Move the slider to see the steps.
Step 1: Open the Browser type the URL Link given below (or) Scan the QR Code. Chapter named “Probability” will open. Select the work sheet “Addition law Mutually Exclusive”
Step 2: In the given worksheet you can change the question by clicking on “New Problem”. Click on the check boxes to see the respective answer.
ICT 8.2: Step 1, Step 2 and Expected results
You can repeat the same steps for other activities